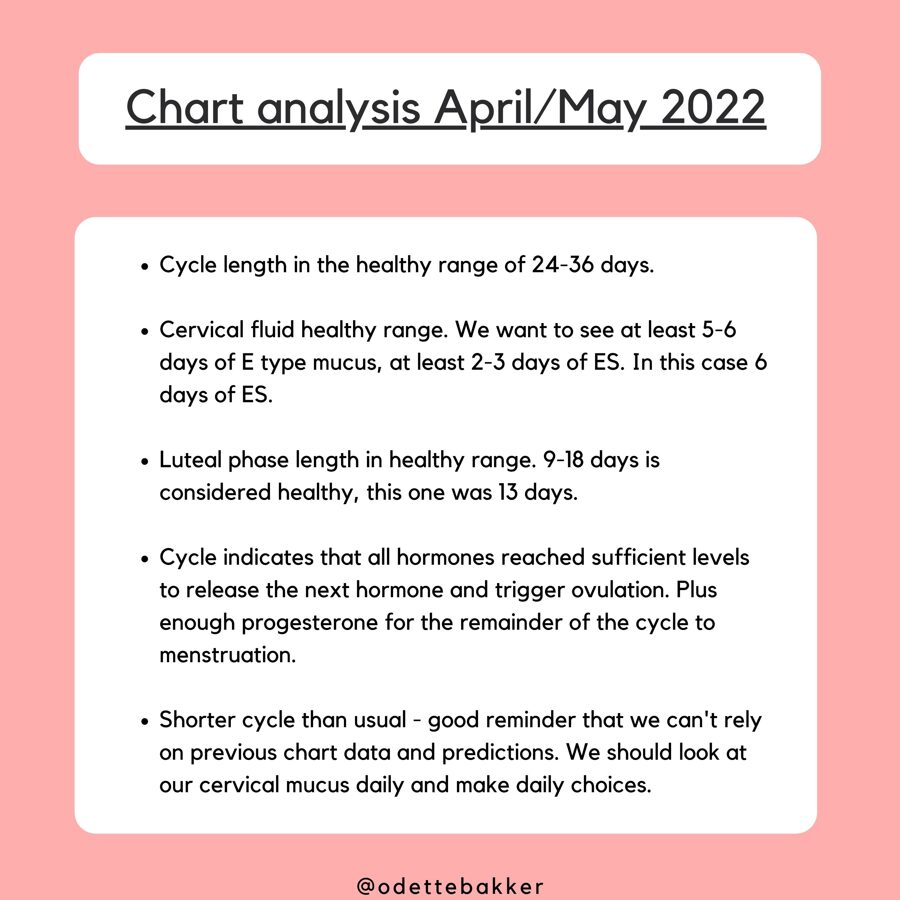
Chart Analysis April/May 2022
May 16, 2022 at 9:19 am,
No comments
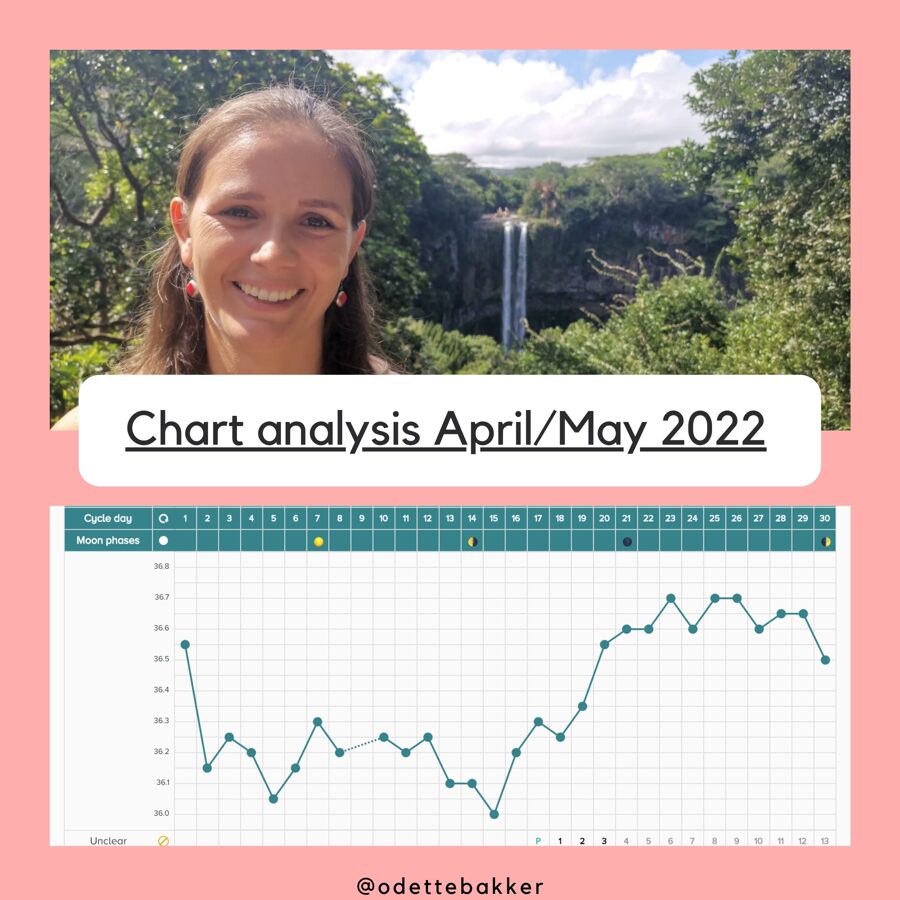
Another month, another chart!
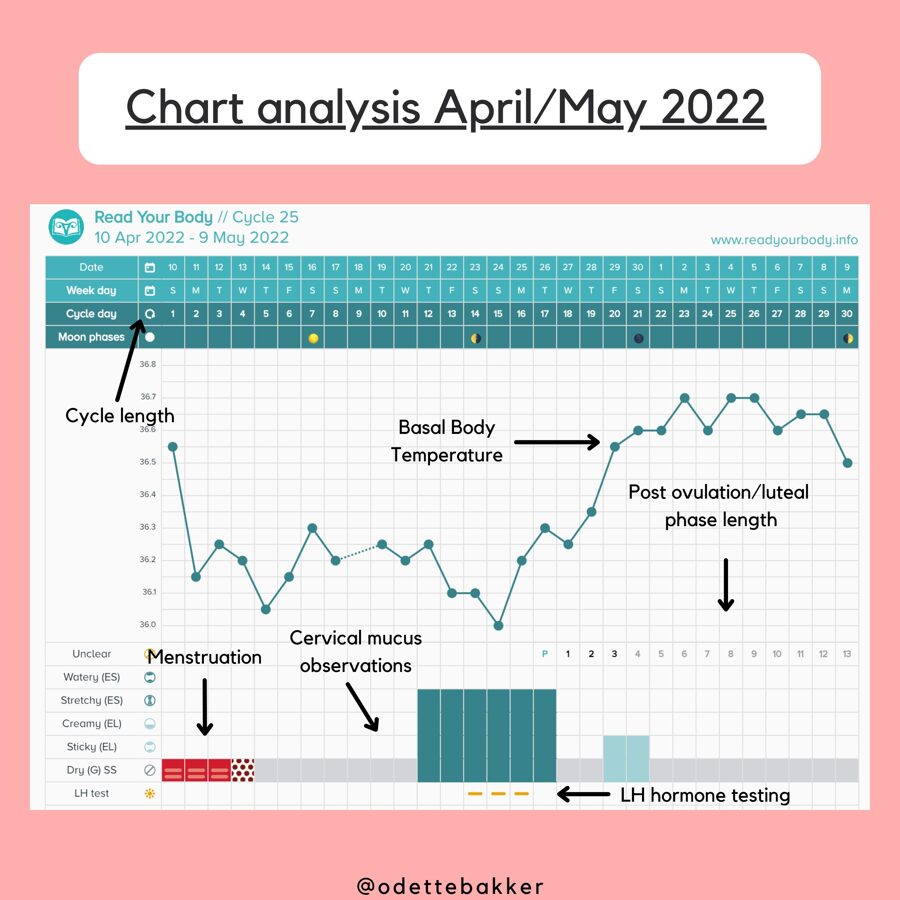
This is what Non-Hormonal Birth Control for Preventing Pregnancy looks like.
I know! It looks complicated! And it looks like it takes a lot of work!
BUT it's really easy once you know what you're looking for!
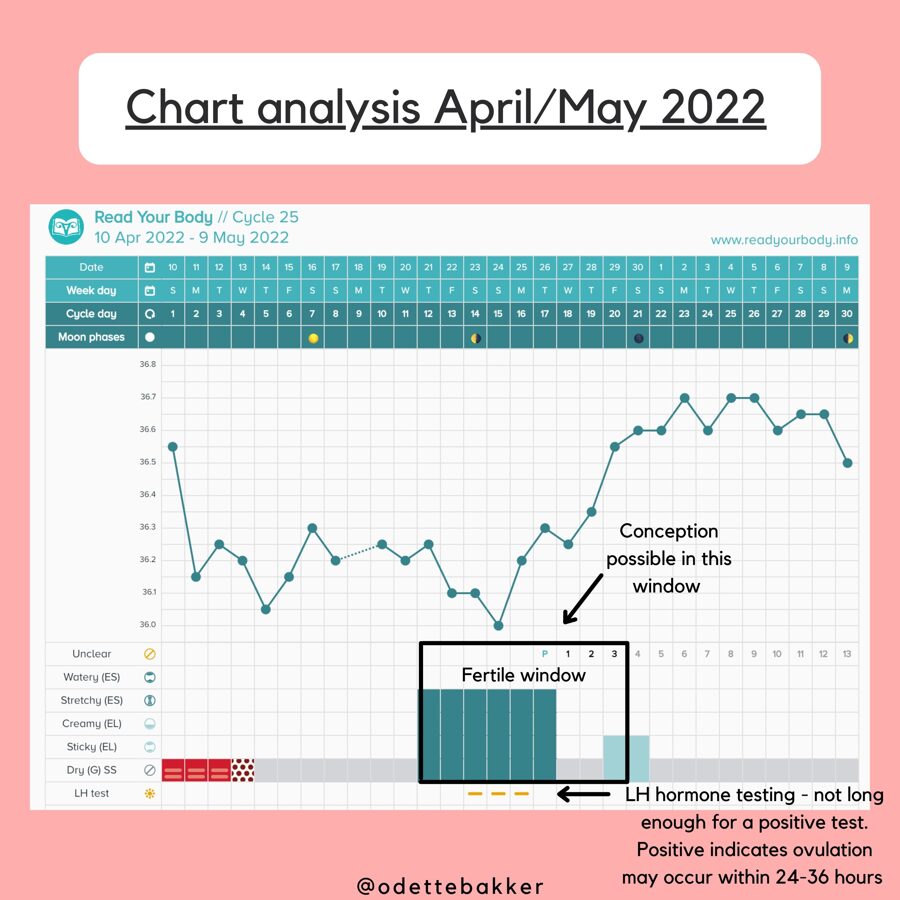
I look at my cervical mucus DAILY! And measure my basal body temperature daily. I test the LH (Luteinising hormone) during the fertile phase. Although this month I didn't test my LH hormone long enough 🙊
A chart can give you insights into your health and not only into pregnancy prevention or achievement:
- Pre-ovulation and post-ovulation phases - with higher temperatures post-ovulation when progesterone is dominant and ovulation has happened.
- Rising estrogen levels - when you start noticing a change in cervical mucus to something that is more moist, stretchy, lubricative or egg-white.
- Fertile window opening and closing where pregnancy is possible.
- Luteal phase length - helps you predict when your period will come. Can vary 1-2 days but it shouldn't change too much.
- In this app - @read.your.body you can customise your charting to whatever you want. I also have sections for mood, activity, PMS, cervical position too.
- Temperature was taken with a device called @tempdrop - REALLY great gadget for measuring basal body temperature without a hassle.
🩸 What would you like to learn more about and was this helpful for you? 🩸
